On the contrary, creating graphs is very easy and anyone who knows how to use the internet can do it. Yes, you can create awesome bar graphs and pie charts using various online tools. However, in this tutorial, we teach you to create graphs in Google Sheets because it’s easy and free. So, without wasting any time lets dive into the tutorial.
How To Make A Chart In Google Sheets
Before we start, make sure you are ready with all the data that you want to put into the chart. Now once you have the data follow these steps to create charts in Google Sheets
1 How To Make A Chart In Google Sheets1.1 Create a Chart1.2 Change The Chart Type1.3 Customize The Chart1.4 Conclusion
Create a Chart
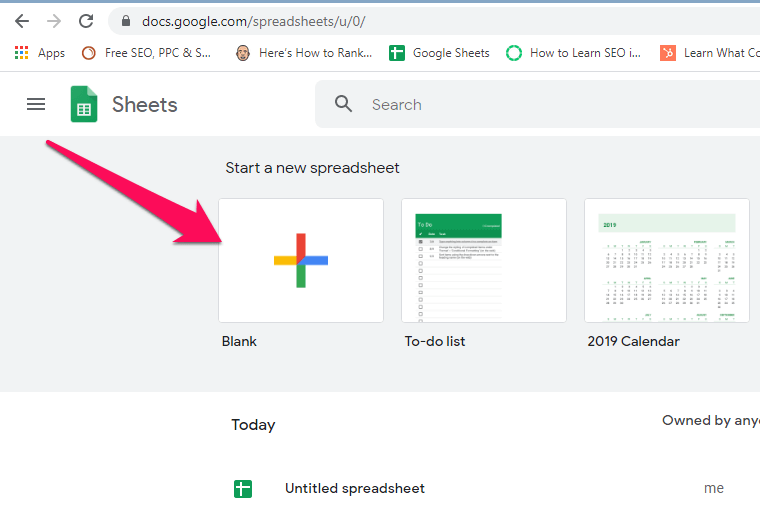
On your browser visit Google Sheets. Now add a new Blank sheet to create a graph and rename the sheet if you want.
Next, add the data with their respective value as shown in the screenshot below.
Now select/highlight all the data in the sheet and click on the insert chart icon on the top right corner.
Now as you do that, you will see a chart pops up on the screen with all the relevant data.
If you are happy with the chart then you download it in PNG, PDF, and SVG format and use it. Click on the three dots icon on the top right of the chart to access the download option
However, if you want to change the chart type to some other formats then keep reading this tutorial. ALSO READ: How To Check Word Count In Google Sheets OR Docs
Change The Chart Type
On the right-hand side under the Chart editor tab, select the chart type box
Now you can select your desired chart type. Google Sheets have various chart formats, from pie chart and bar graphs to line, area and others.
Once you find your desired chart, select it and the main chart on the screen shall change accordingly.
Now you can either download this chart or you can further customize it.
Customize The Chart
If you want to make the chart more personalized then you can do that by customizing it and for that, you can follow these steps.
On the chart click on Edit chart. The chart editor will open on the right side, now select Customize.
Under customize settings you get various options like Chart style, Chart & axis titles, Series, Legends and much more.
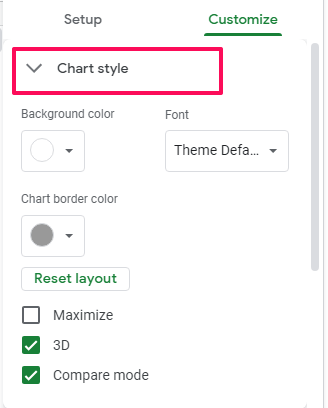
Note: The customization options are different for different chart types. 3. To change the font style or chart’s foreground and background color you can select the chart style option. You can also change the chart layout from 2D to 3D using this option.
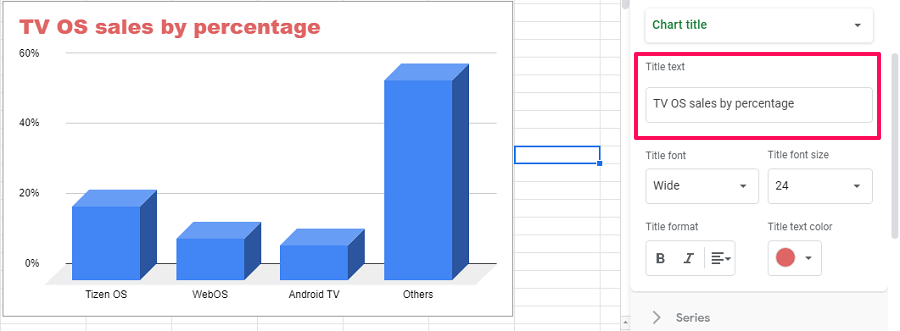
- Similarly, if you want to add a title to the chart then you can do that by selecting the option Chart & axis titles. Here you can give your chart a title or a subtitle. Also, you can add a title to the X and Y-axis from here.
Now similarly, you can use all the options under the customize settings and make the chart more personalized. If you still face any problem while creating and customizing charts on Google Sheets then you can read this tutorial for help.
Conclusion
With this, we have come to the end of this article. We hope we help you out in creating charts in Google sheets. Also as you saw it is very easy to make charts in Google Sheets, you just need to fill the data and leave everything to Google sheets. Moreover, you can create a different type of charts in it that meets all your requirements. In the end, we will just like to say that Google Sheets is an awesome free tool to create charts online and anyone can use it.